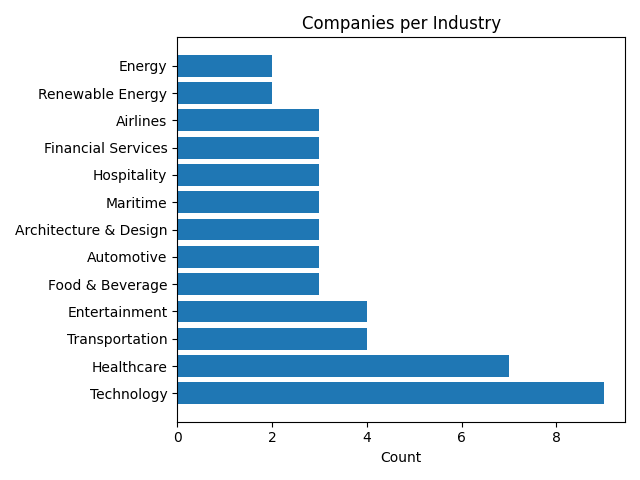
Bar Chart from Value Counts
Turn the industry frequency counts into a horizontal bar chart that shows which industries are most represented.
Premium
Expected:
Output:
Python
Setting up Python environment... Output
Setting up Python environment...