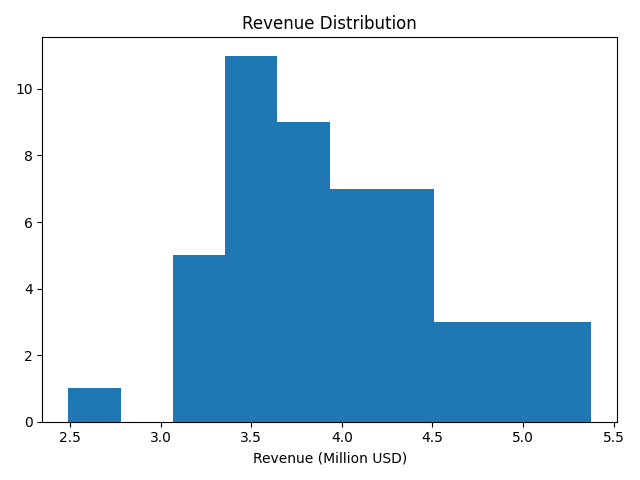
Revenue Distribution Histogram
Are most companies clustered around similar revenue, or is it spread out? Create a histogram to see the distribution.
Premium
Expected:
Output:
Python
Setting up Python environment... Output
Setting up Python environment...