p
y
c
h
a
l
l
e
n
g
e
r
Home
Basic Data Analysis
Matplotlib
Create first plot
Create first plot
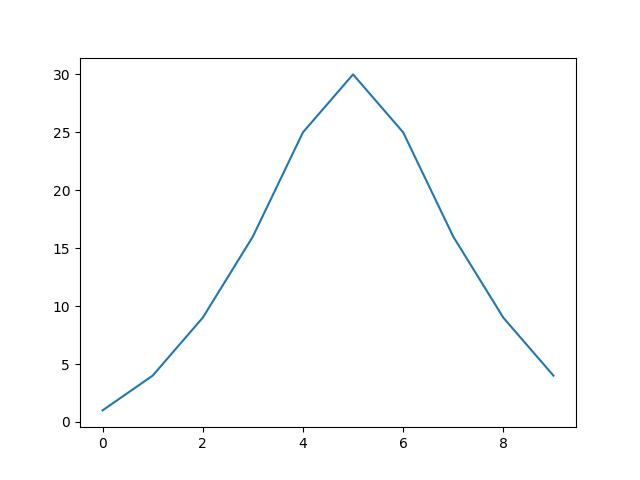
Let's create our first line graph with
matplotlib
. Make a plot that matches the expected one using the provided data.
Expected:
Output:
reset
import matplotlib.pyplot as plt y = [1, 4, 9, 16, 25, 30, 25, 16, 9, 4] # complete code here
plt.plot(
plt.show()
Python
Setting up Python environment...
Output