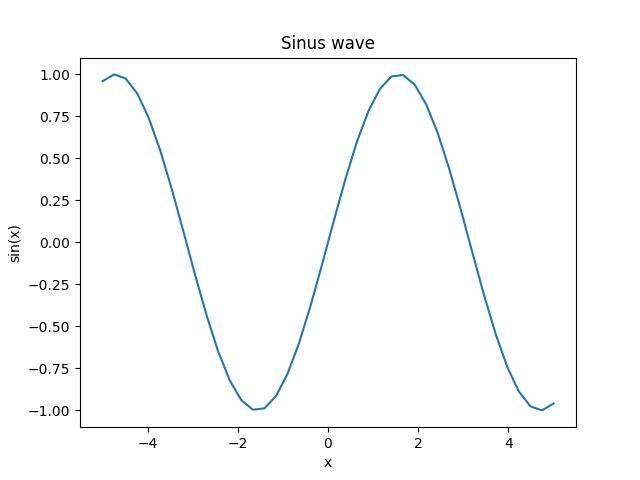
Sinus wave
Create a plot that matches the expected one by using the provided data. This time, you will also need to add a title and label the axes.
Premium
Expected:
Output:
Python
Setting up Python environment... Output
Setting up Python environment...