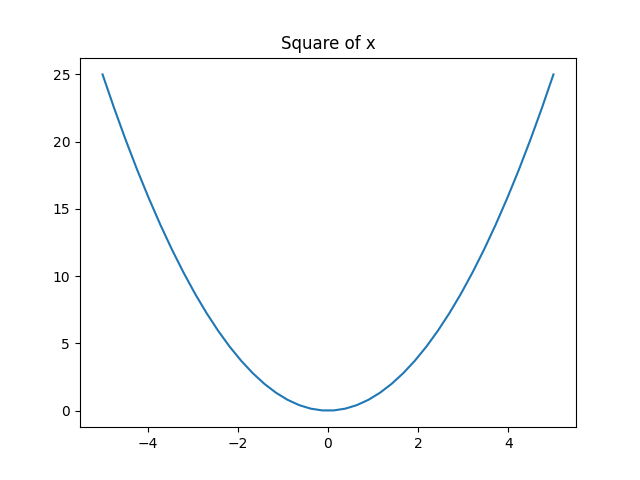
Create line plot with title
Create a plot that matches the expected one by using the provided data. Don't forget to add the correct title.
Premium
Expected:
Output:
Python
Setting up Python environment... Output
Setting up Python environment...