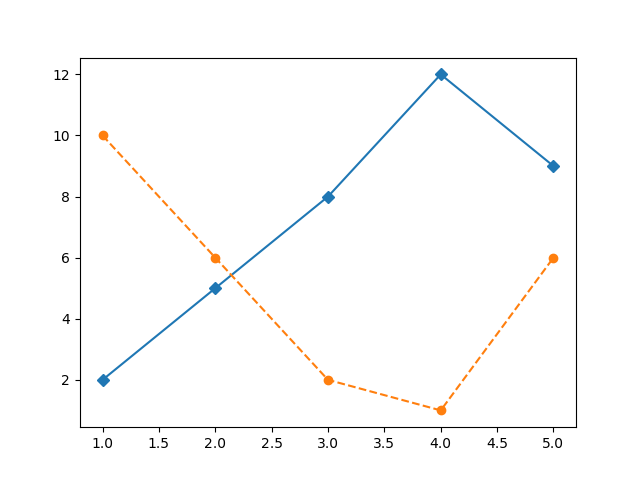
Exercise: Add Second Line to Plot
Add a second line to the plot using the provided data. Make sure it matches the appearance of the line shown in the expected output.
Premium
Expected:
Output:
Python
Setting up Python environment... Output