p
y
c
h
a
l
l
e
n
g
e
r
Home
Basic Data Analysis
Matplotlib
Change appearance of plot line
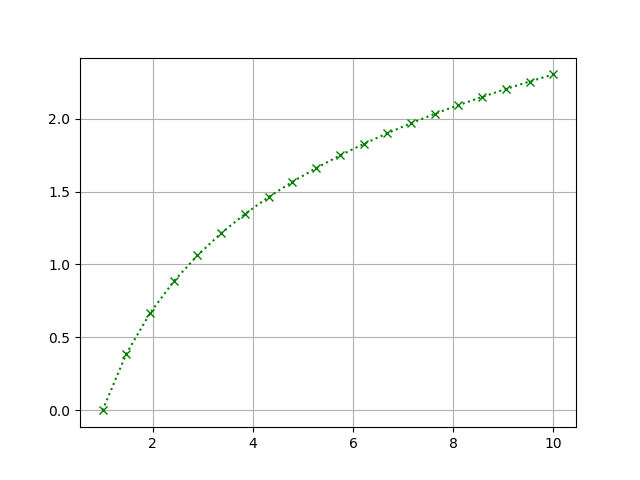
Change appearance of plot line
Change the appearance of the plot line to match the expected outcome.
Premium
Expected:
Output:
reset
def greet(name): return f"Hello, {name}!" print(greet("Erik"))
Python
Setting up Python environment...
Output