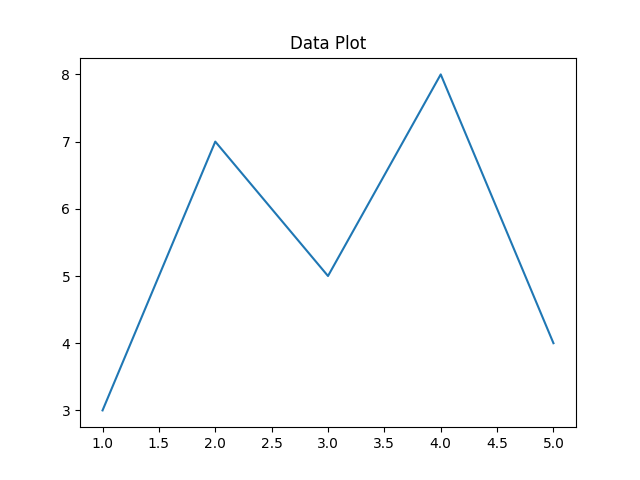
Plot With Two Data Lists
Complete the
plt.plot() call by adding y as the second argument to plot it against x.Premium
Expected:
Output:
Python
Setting up Python environment... Output