Exercise: Multi-Line Plot with Random Values
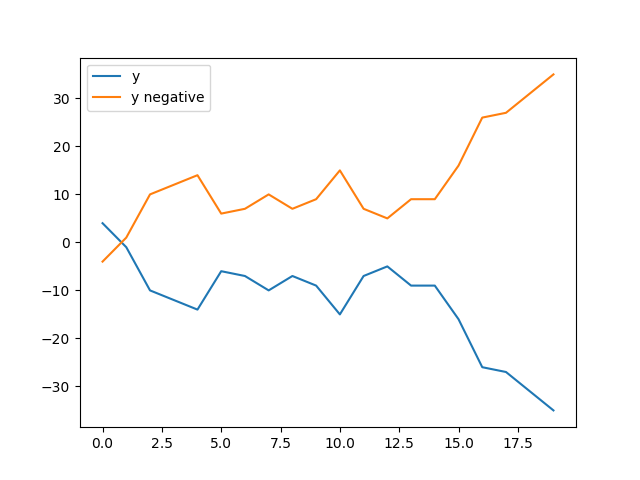
Create a plot with two lines: the first one should plot x against y, and the second one should plot x against the negative of y. Don't forget to add the expected legend.
Premium
Expected:
Output:
Python
Setting up Python environment... Output