Exercise: Multi-Line Plot with Legend
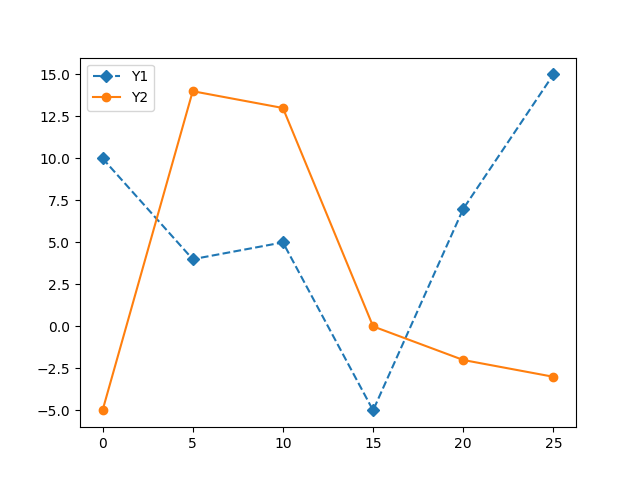
Add a second line to the plot using the provided data. Also add a legend to differentiate each line. Match the legend and line appearance in the expected output.
Premium
Expected:
Output:
Python
Setting up Python environment... Output