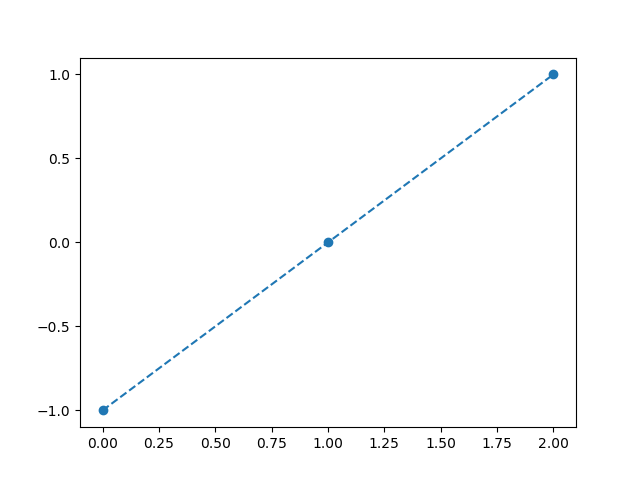
Linear Data with Markers
Create a plot that matches the expected one. This time, you will need to generate the data yourself, but it should be easy since there are only three data points. You will also need to apply some line styling and adjust the ticks on the Y-axis.
Premium
Expected:
Output:
Python
Setting up Python environment... Output