Create Line Plot With Grid
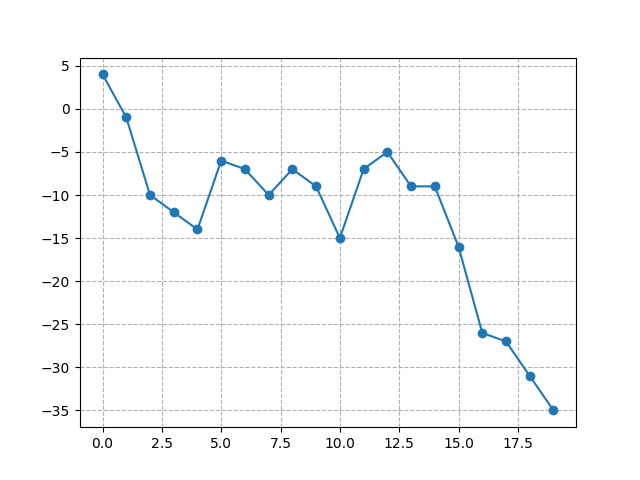
Create a line plot with the given data and expected markers. Add a grid that matches the one in the image.
Premium
Expected:

Output:
Python
Setting up Python environment... Output

Setting up Python environment...