Matplotlib II
Pie Charts
Learn how to create pie charts using plt.pie() and how to display percentage labels with the autopct parameter.
Pie charts show how a whole is divided into parts. Use plt.pie() — pass a list of values and matplotlib calculates the proportions automatically.
A basic pie chart only needs the data values. Labels are optional but strongly recommended:
Python
Output
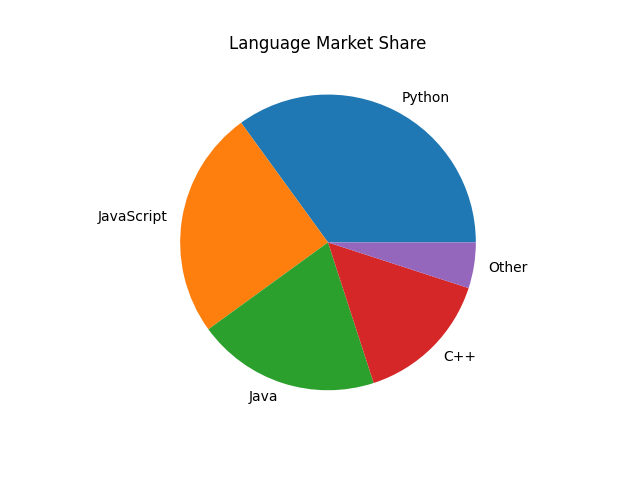
The values don't need to sum to 100 — matplotlib calculates each slice's percentage from the total automatically.
What will be the output?
Python
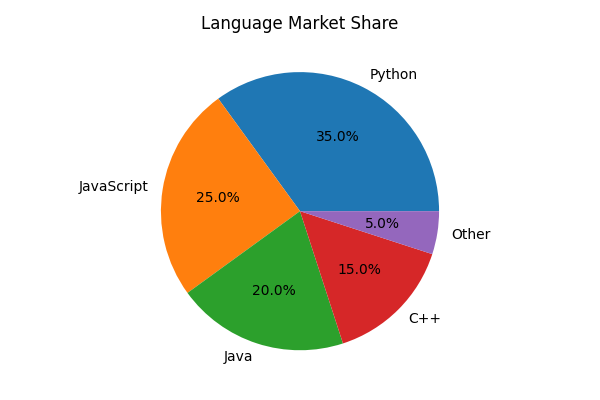
Add the autopct parameter to display percentages directly on each slice. '%1.1f%%' shows one decimal place:
Python
Output
What will be the output?
Python
What will be the output?
Python
What will be the output?
Python
What will be the output?
Python