Matplotlib

Customizing line appearance

In this lesson, you will learn how to change the appearance of the plot lines.


Let's generate some random data with NumPy and plot it:

import matplotlib.pyplot as plt import numpy as np # Generate data np.random.seed(80) y = np.cumsum(np.random.randn(100)) plt.plot(y) plt.show()
Python
Output
example plot

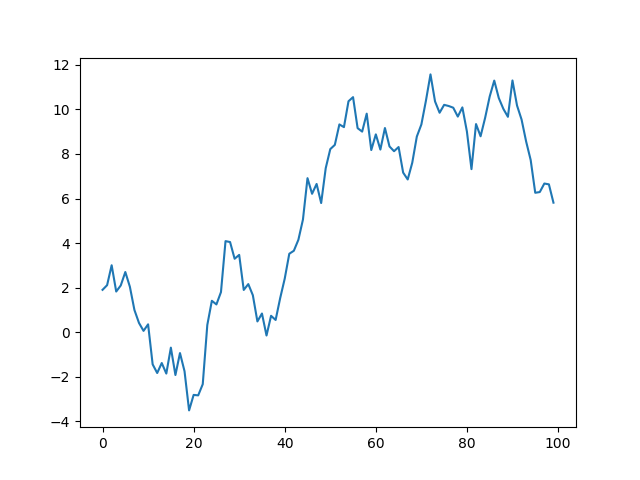
Just by default, the figures generated by matplotlib look pretty nice.

Nevertheless, matplotlib offers countless customization options.

Let's take advantage of this and adjust the look of our line:

import matplotlib.pyplot as plt import numpy as np np.random.seed(80) y = np.cumsum(np.random.randn(100)) # customize style of line plt.plot(y, linestyle='--', color='green', linewidth=1.5) plt.show()
Python
Output
example plot

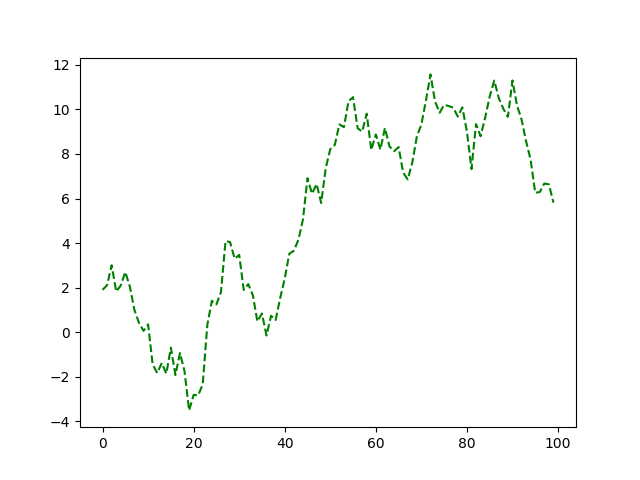
Here, we have changed the style, color, and width of the line.

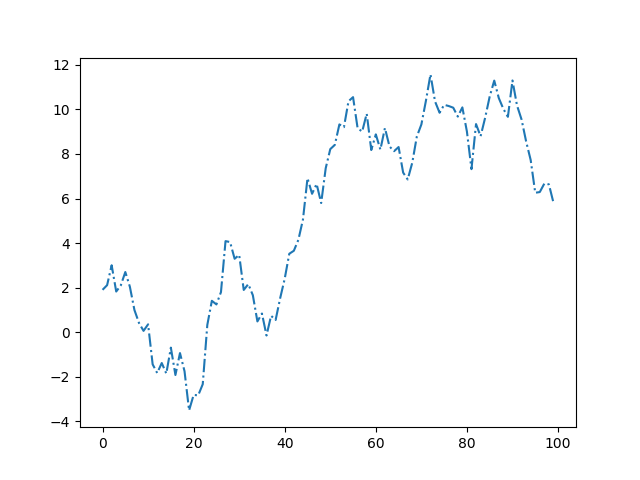
The linestyle argument accepts specific values, which can either be symbols or descriptive names of the style:

# solid line '-' or 'solid' # dashed line '--' or 'dashed' # dotted line ':' or 'dotted' # dash-dot line '-.' or 'dashdot' # no line '' or 'none'
Python

Instead of specifying linestyle as an argument, you can also simply type ls. For instance:

import matplotlib.pyplot as plt import numpy as np np.random.seed(80) y = np.cumsum(np.random.randn(100)) # customize style of line plt.plot(y, ls='-.') plt.show()
Python
Output
example plot

You can even hightlight individual data points with markers using the marker argument:

import matplotlib.pyplot as plt import numpy as np np.random.seed(80) y = np.cumsum(np.random.randn(100)) # customize style of line plt.plot(y, marker='.') plt.show()
Python
Output
example plot

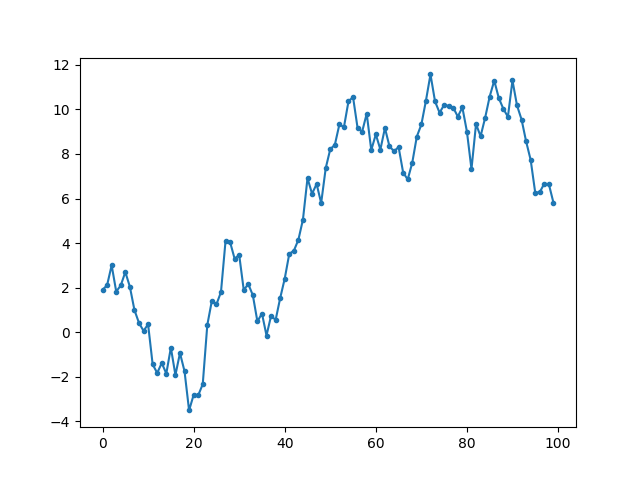
There are various possible markers that you can add.

Here are some of the most common ones:

'.' # point marker (small dot) 'o' # circle marker 's' # square marker '*' # star marker '+' # plus marker 'x' # X marker
Python

Great! Now you know many ways to adjust the appearance of the line.